How bad is Corona really?
Corona in Belgium: Several months of lockdowns, a year of brutal closing of our cultural sector. Bars and restaurants closed for 8 months by now. A ban on travelling, a night clock as the new normal... Mandatory masks in all public buildings for everyone older than 10. Face masks in many cities and even when walking along the seashore with outrageously high fines for all offenders. And worst of all... If you hug more than one extra person, you are a villain that endangers the public health. And our children are indoctrinated to keep distance in order not to kill their grand-parents!
Like in many countries, Belgium has taken all kinds of (ineffective) measures in a useless attempt to influcence the respiratory Corona virus. And the question is... how bad is corona really?
This site defends six points of view:
- The real excess mortality is significantly lower
- The risk of death has only increased to a limited extent.
- The people die with Corona , not Corona
- The measures have no proven effect on the course of the infections
- The measures , if they work at all, target the wrong target audience
- The explanation about Corona is full of incongruities
All these topics are elaborated extensively based on the Belgian numbers in both Dutch and French. However, this page contains a pretty detailed overview of the main elements of the calculations. Enjoy!
A quick look through some Belgian statistics
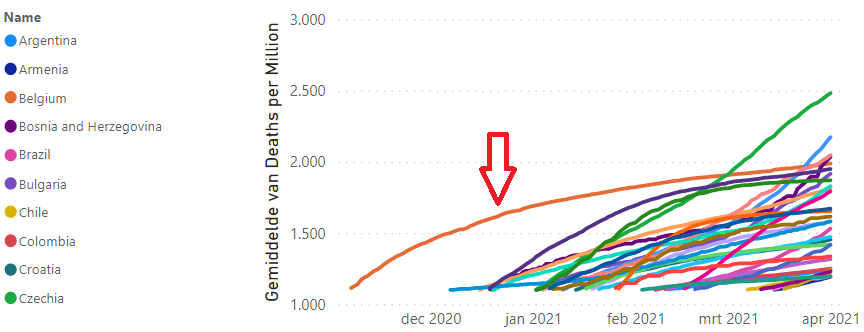
Americans asked me what happened in the hell-hole Belgians. With 1704 COVID-19 deaths per million on Dec 31st, we reported the highest number of deaths in the world, apart from 2 mini-states (Monaco and Gibraltar). Today, we are still playing in the top of the COVID-19 Champions League, but recently we have been taken over in terms of deaths per million... The picture underneath created via PANDA (Pandemics - data and analysis) is summarizing this nicely
Was our country a free-thinker on COVID-19? Unfortnunately it wasn't. Even today, our social isolation is one of the most surrealistic in the world (1 real 'contact' allowed only, 4 distant contacts in open air, children are still urged to keep distance to avoid killing grandfather and grandmother)... And of course mouth masks are enforced (with unseen penalties for offenders) where-ever some fun gathering of people could arise. Social events, cultural events, bars and restaurants... All closed. And why?
Here you see an overview of the deaths and an overview of the measures in 2020.
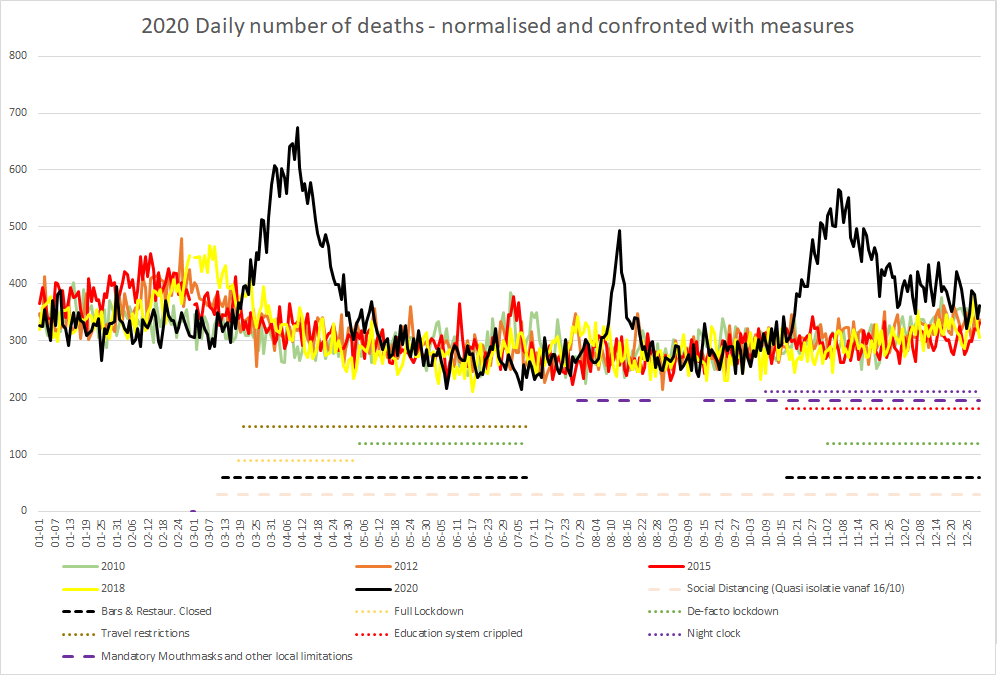
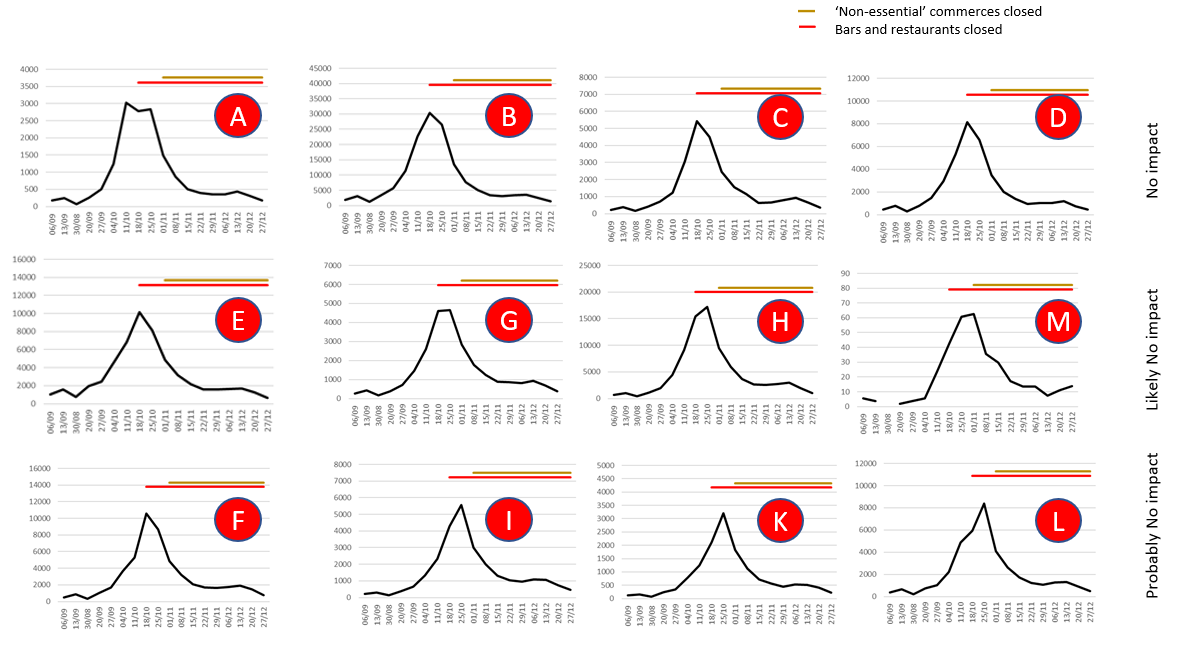
Some people see this graph as a 'proof' that the measures work. However, you have to look closer. In the graphic underneath, cities were grouped in categories that had a 'similar' growth and peak of positive PCR tests (aka 'contaminations'). The results are cristal clear. Measures had hardly an impact (if an impact at all). Viruses / contaminations just come and go as they typically do.
It is clear that, in 219 cities / municipalities (37.7%), the re-closure of our bars and restaurants was absolutely irrelevant. And in another 146 cities / municipalities (25.1%) the re-closure of our bars and restaurants was probably irrelevant. In + 99% of the cities / municipalities, the peak had already passed when non-essantial commerces needed to close. Just insane... Have a look yourself:
A quick look through some Belgian statistics
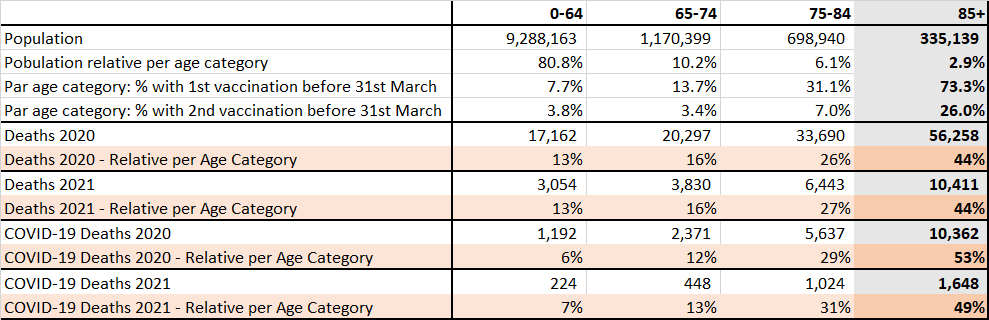
The ultimate solution for this Belgian government looks to be a massive vaccinnation. Whether or not vaccination will have a significant impact still remains to be seen... Allthough it probably is still too soon and although there could be some advantages to vaccinnation, the results so far are far from overwhelming. With 75% of our vulnerable 85+ population (at least partly) vaccinated, one could expect a change in the mortality mix, but we hardly see an improvement ... Perhaps 2020 was a perfectly normal year after all...
But if not COVID-19, how do you explain these 'peaks' of deaths?
One actually sees three significant peaks in the 'deaths' overview above. The thin peak was in August and it was the biggest peak observed ever for a typical 'heat wave' peak even though it did not contain any (or hardly any) COVID-19 casualties. Where does that peak come from. What did we miss? The following diagram shows that there is a trend we might have missed...
A very interesting study in this context is that of Prof. Toussaint and his colleagues: Covid-19 Mortality: A Matter of Vulnerability Among Nations Facing Limited Margins of Adaptation They have analyzed the number of Corona victims around the world. Their study did not attempt to answer the viral aspects. Their findings were both incredibly simple and genius.
The following countries had the most victims:
- Countries with a high, already stagnant life expectancy
- Countries with a high life index
- Countries with a well-developed health system, characterized by e.g. the fact that even people with chronic conditions can maintain relatively normal lives
The study also did not look at the direct impact of the individual measures, but it did look at the total of measures. Their conclusion is: The strictness of the measures to combat the pandemic, including lockdown, does not appear to have an impact on the mortality rate.
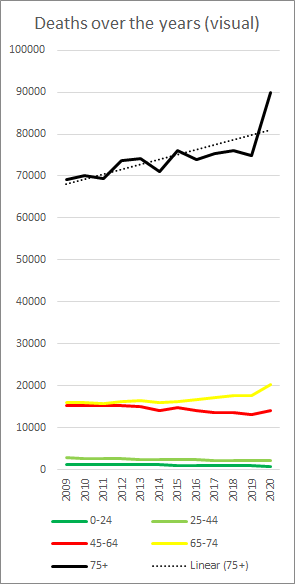
An interesting database to help understand a countries demographics is the Human Mortality Database. It collects and shares demographic statistics over a long period. I checked the data with local Belgian data and, about for some percentpoint of changes, the data is pretty good for a demographic analysis. The disadvantage, that it only contains data up to 2018-2019, is not a real problem. I augmented the statistics with reported or estimated figures for the last two years. A first set of graphics gives insight in the population growth. Important to notice is that we do not just have a 'linear' growth of the population, but rather a polinomial growth of 65+, and an exponential growth in the 85+ population and very recently, the 95+ population
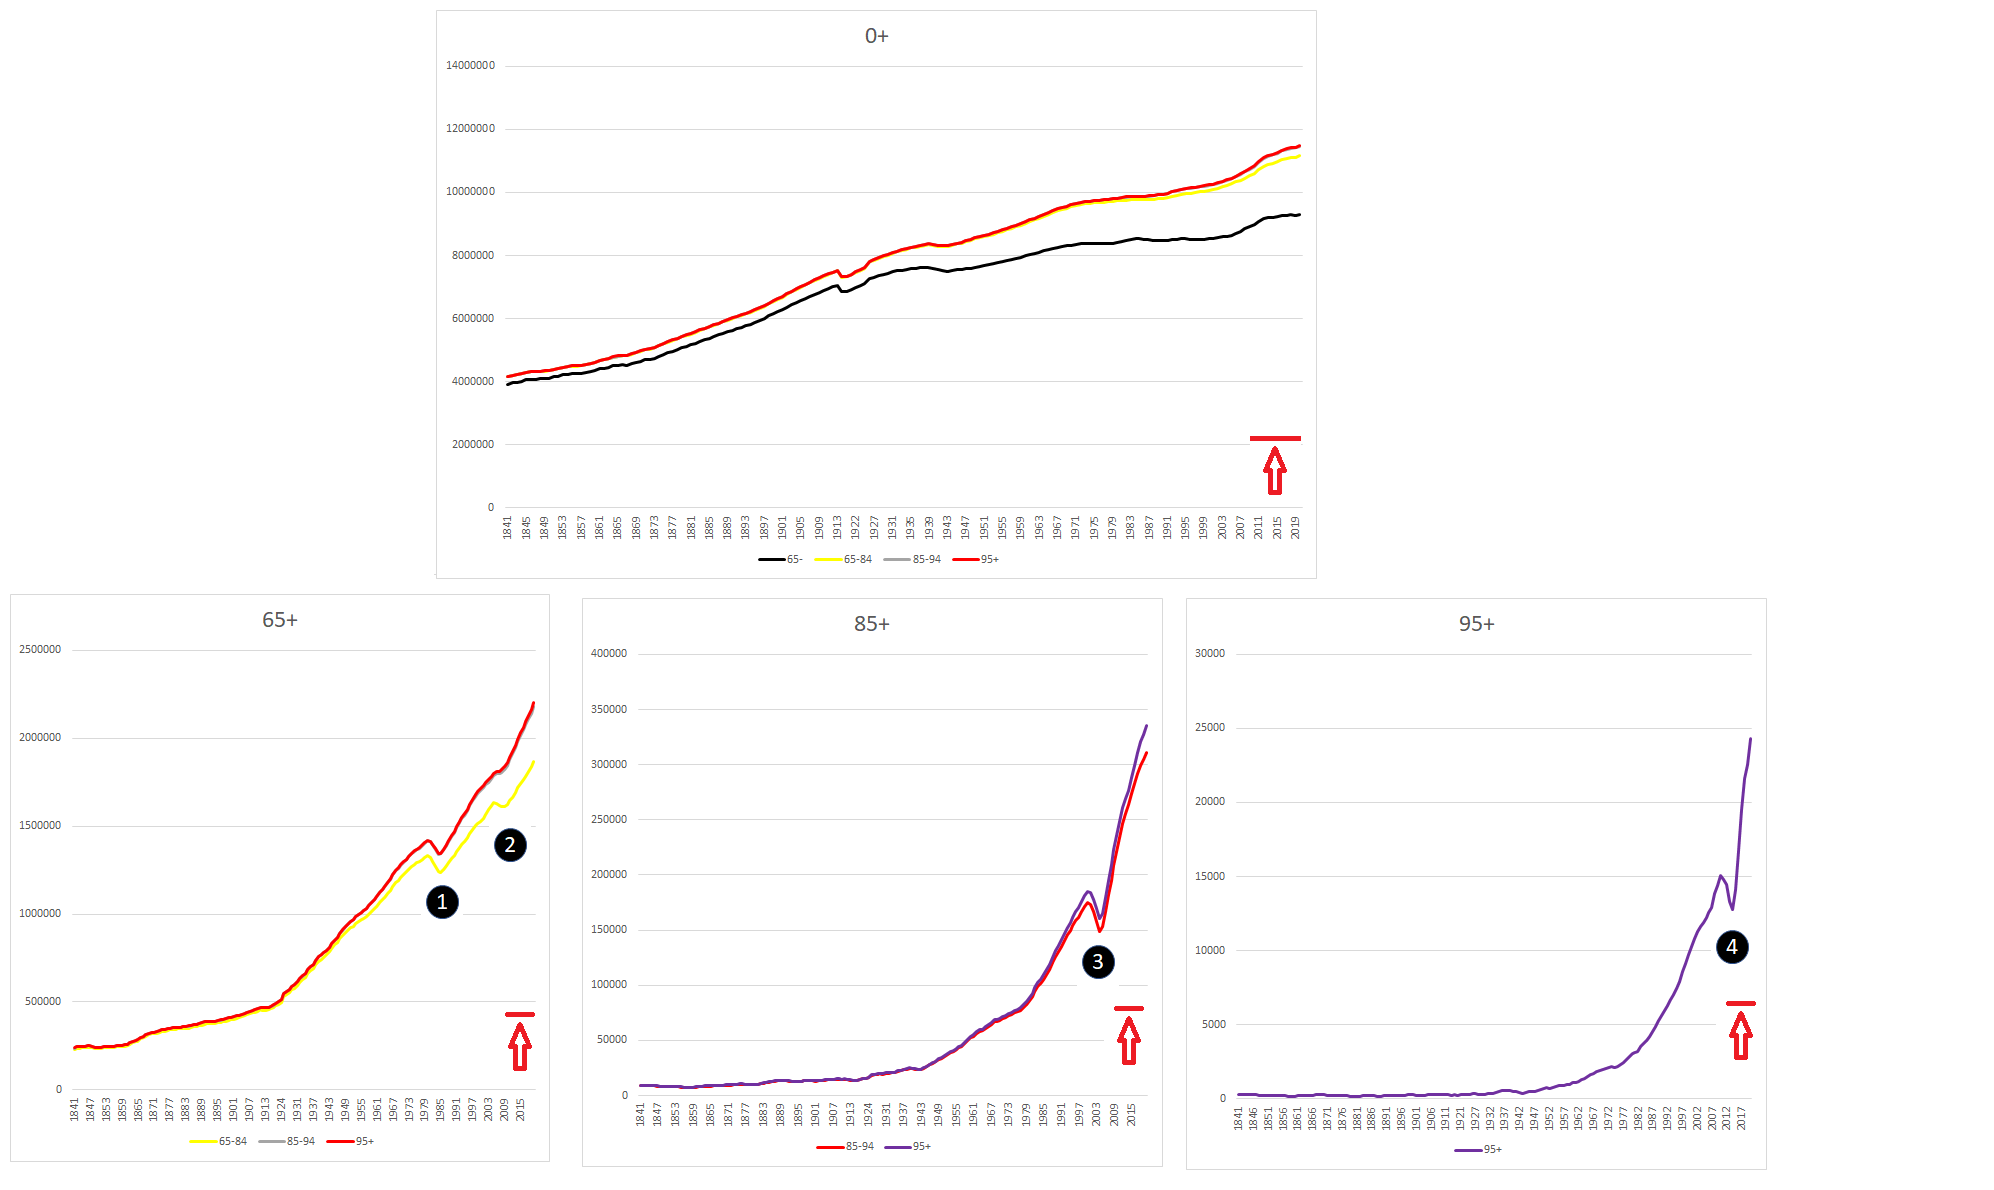
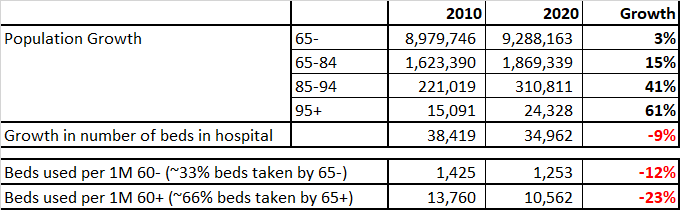
Allthough the last two years are extrapollated (the exact numbers have not been published yet), the trend is very clear. Thanks to our well-developed health system, and by our capability to take care for people with chronic conditions, we see very significant growth figures. When comparing 2010 with 2020 the growth figures are: 65-85 (+15%), 85-95 (+41%) and 95+ (+61%)
So, what did our government? Like many other governments did... they reduced the number of beds! In Belgium there was a reduction of hospital beds with 9%...
However, the effect is a lot more drastic when taking into accounts the 'age categories'. Generally speaking, people under 65 (80% of the population) typically consume about one third of the beds, whereas people over 65 (20% of the population) consume over two thirds of the beds. So, accounting for the reduction of beds, a real reduction of 23% of the beds can be estimated as available for the 65+ cat.
So it shouldn't come as a surprise that outbreaks of a resporatory virus like COVID-19 can suddenly bring hospitals in trouble. And they get in trouble... every year...
The correct solution would have been to, on the one hand, help people stimulate there immunity and other activities to keep them out of the hospitals. On the other hand an increase in the capacity would have been justified. Instead, nothing is done or better, extra money is saved by reducing beds, but now when a perfectly normal peak arises the following actions are taken:
- the most exotic drug in the procedures for treatment of Covid by the first line healthcare persons (doctors) seems to be a paracetamol (analgesic and fever reducer). Any advanced treatment of this diseaese apprantly can only be decided in a hospital...
- All non-urgent medical interventions in hospitals are postponed (a recipy for a lot of collateral dammage)
- the measures that are taken (lock down, cultural sector closes, bars and restaurants closed, commercials closed, night clock,...) are targeting primarily the 80% of young, healthy persons that hardly suffer from any discomfort from Covid ... The idea being that these actions will lead to a reduced number of people in the 65+ category going to the hospital. So an indirect, very marginal impact at the least...
- We live under a reign where a lot of people live under constant fear because of the scaremongering, and the sensational and propagandic communication. In fact, an analysis of produced articles from a belgian 'quality' paper revealed only 7.5% is real investigative journalism the rest was a.o. propaganda, sensations and drama...
But we are in a third wave. Hospitals are observing a steep growth of Covid-patients again. We have to stop this. No?
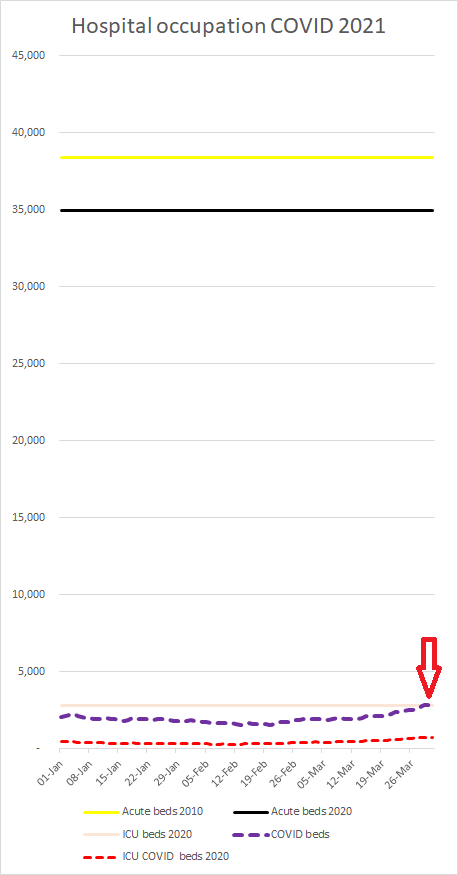
We do come here in a dangerous domain and we have to be careful with any allegations. But the communication about the situation in the hospitals is doubtful in many aspects... So let me just provide some three statistics and let you draw your conclusions yourself...
Statistic 1: Since the beginning of this year, there has been a COVID patient in less than 1 in 20 beds and one in less than 1 in 6 ICU beds. The last 4 weeks there has been a 'peak' in intensive care of slightly more than 1 in 4 ICU beds ... The number of beds occupied by COVID patients has also risen to 1 in 10, but you can currently still give all COVID patients an ICU bed ...
Statistic 2: Off course there is soma appearance with a possible third wave, which has already been announced for the 10th time. The origin of the panic is a fanatic observation of the ICU occupation. This statistic gives a complete overview of the decrease / increase in intensive care
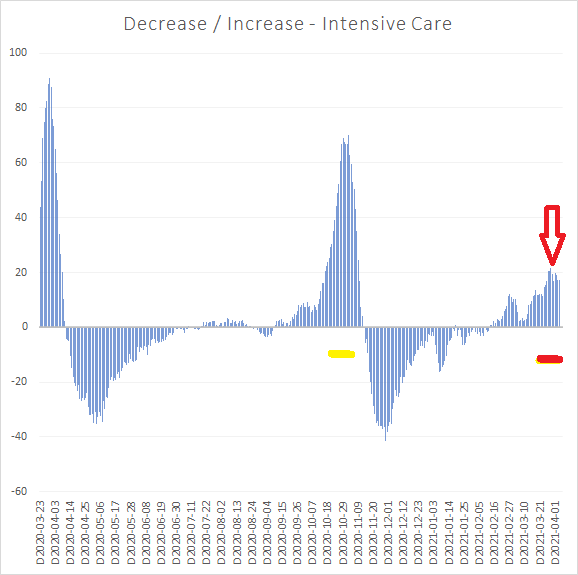
The duration of the third wave is already close to that of wave number two but it has never entered the exponential phase. Surprisingly, the increase in hospital admissions did not stop when predicted on this site, but found a new breath.
Consider the graphic underneath: In yellow we see how our hospitals were operating in the middle of the second wave. Only the worse cases end up in ICU and so the average is less than normal. The rise in number of patients is also progressing dramatically fast.
The red observations are those of the (alleged third wave) and what do we observe?
- On average, there are +25% more patients in ICU than during the first wave, whereas the second wave had 20% less patients in ICU than the first wave
- Also, the increase in the number of beds is much slower. Not only are there twice as many measuring points here, but the increase is also 3 times slower. So ... not even a sixth worse of the second wave.
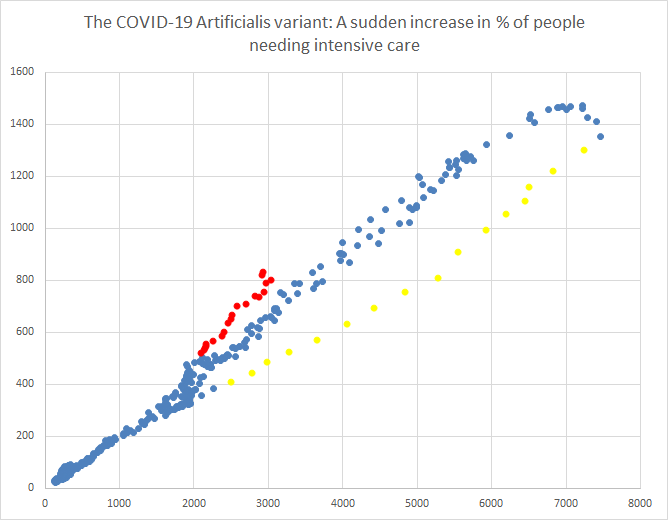
If I look at the numbers like this ... It would not surprise me that the patients in intensive care, today are in a better condition than in earlier days... But anyway. I am not a doctor so maybe we are dealing with an extremely bad variant here. I would recommend a new name... a Belgian Variant: The COVID-19 Artificialis variant?
Conclusion: How bad is Corona really?
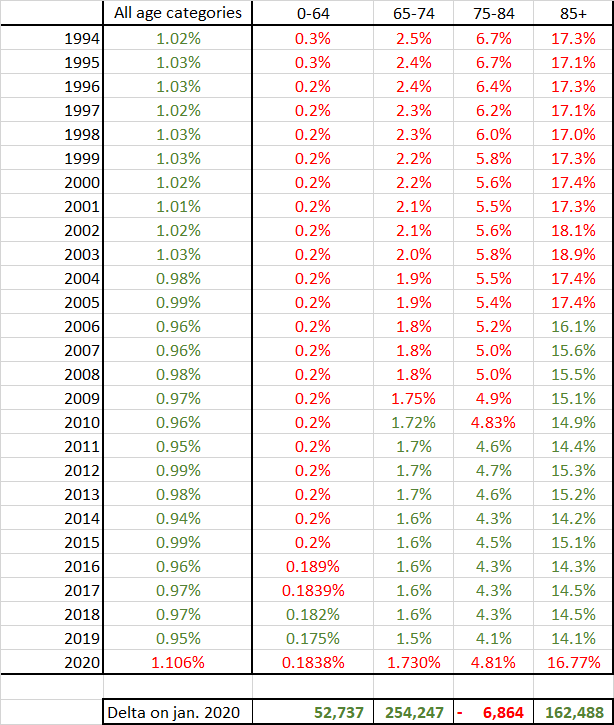
So we see that the major impact comes from people getting older and older with two categories of people in an exponential growth phase: 85-95 and 95+. Refined deathrates cannot be calculated, but they will not be worse thant the table underneath. So it means that the situation in this era of Covid is not worse than let's say 10 to 15 years ago. In addition in this era, you have nearly twice us much chance to get into the 85+ category. For me this means that, even with COVID-19, this is the best time ever....
Based on the above information and on vaccination risk information published by famhp, we can construct a risk profile.
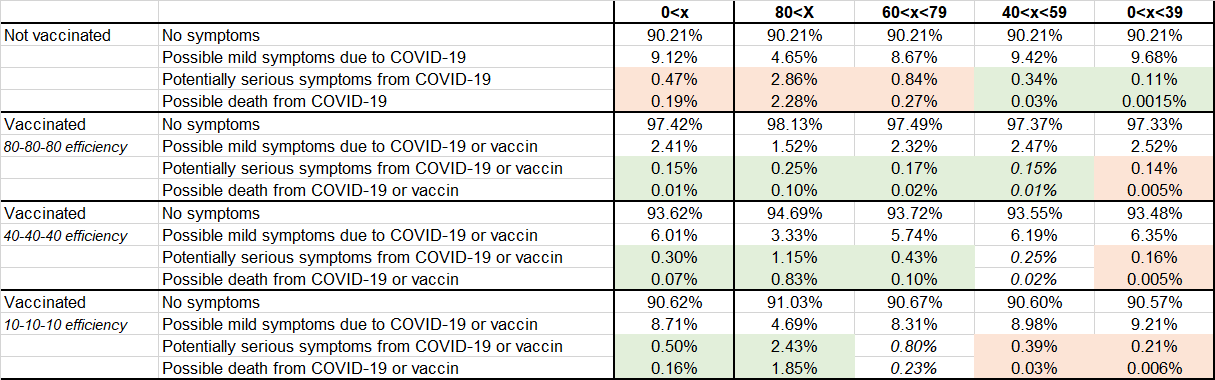
Observing these profiles, the expected recommendation I would expect from the government would be:
- if you are younger than 60 , (chance-technical) you should actually not * get vaccinated.
- if you are younger than 40 , (chance-technical) you are actually better never * vaccinated, even if the effectiveness of the vaccines is as good as 3x 80% (80% less chance of COVID-19, 80% less chance of serious side effects, 80% less chance of death)
For more information on the vaccination, see the Flemish web site.
More information
Hoe erg is Corona echt? (Dutch web site)
Covid-19 vrai ou faux? (French web site)